How to Install the DigitalOcean Metrics Agent
DigitalOcean Monitoring is a free, opt-in service that gathers and displays metrics about Droplet-level resource utilization. Monitoring supports configurable alert policies with integrated email and Slack notifications to help you track the operational health of your infrastructure.
To enable extended metrics and enhanced monitoring features, like metrics-based alerting, you need to install the metrics agent on your Droplet. You can do this automatically when you create a Droplet, or manually after you create a Droplet.
Installing the Metrics Agent During Droplet Creation
Using the Control Panel
To install the metrics agent during Droplet creation with the control panel, find the We recommend these options section and click Enable Monitoring:

The metrics agent will be automatically installed and enabled during the Droplet creation process.
Using the API or CLI
If you are using the DigitalOcean API to create Droplets, set the monitoring attribute to true in the creation parameters to automatically install the metrics agent on the Droplet during creation. The Droplet creation section of the API documentation contains additional details.
If you are using doctl, the DigitalOcean command line client to create Droplets with the doctl compute droplet create command, use the --enable-monitoring flag to enable monitoring.
Installing the Metrics Agent Manually
You can also install the metrics agent manually on supported operating systems and versions. There is an installation script available that automatically detects the client operating system and configures repositories to install the agent. If you are uncomfortable running an installation script, you can set up your repositories manually.
With an Installation Script
An installation script is available to install the metrics agent manually. The script will add a repository to your system and use the native package manager to install the metrics agent. This simplifies package management tasks like upgrading or removing the metrics agent.
Log in to your Droplet as root or as a user with sudo access:
ssh root@203.0.113.0
Once connected, to install and enable the metrics agent immediately, you can download and execute the installation script by typing:
curl -sSL https://repos.insights.digitalocean.com/install.sh | sudo bash
You may be prompted for your password if running as a sudo user.
If you would like to audit the script before installing, you can write it to disk first, then view the contents and run it manually.
curl -sSL https://repos.insights.digitalocean.com/install.sh -o /tmp/install.sh # Save the script
less /tmp/install.sh # View the contents
sudo bash /tmp/install.sh # Run the script manually
The agent should now be installed and running.
Configuring Repositories Manually
You can also add the repositories and install the package manually if you prefer.
To add the metrics agent repository, create and open a file in the /etc/apt/sources.list.d directory with sudo privileges:
sudo nano /etc/apt/sources.list.d/digitalocean-agent.list
Inside, add the following line:
deb https://repos.insights.digitalocean.com/apt/do-agent/ main main
Save and close the file.
Next, add the DigitalOcean key to apt by typing:
curl https://repos.insights.digitalocean.com/sonar-agent.asc | sudo apt-key add -
Now you can update the repository package index and install the Agent by typing:
sudo apt-get update
sudo apt-get install do-agent
The agent should now be installed and running.
On CentOS or Fedora, create and open a repository definition file with sudo privileges:
sudo vi /etc/yum.repos.d/digitalocean-agent.repo
Inside, paste the following configuration:
[sonar]
name=do agent
baseurl=https://repos.insights.digitalocean.com/yum/do-agent/$basearch
failovermethod=priority
enabled=1
gpgcheck=1
gpgkey=https://repos.insights.digitalocean.com/sonar-agent.asc
Import the DigitalOcean key by typing:
sudo rpm --import https://repos.insights.digitalocean.com/sonar-agent.asc
Now, you can install the metrics agent by typing:
sudo yum install do-agent
The agent should now be installed and running.
Verify the Agent is Running
No matter how you install the agent or which operating system you use, you can verify it is running from the command line with:
ps aux | grep do-agent
When you receive output with a line something like the one below, then the agent is running:
do-agent 3238 0.0 0.2 791812 17280 ? Ssl 15:24 0:00 /opt/digitalocean/bin/do-agent --syslog
Once the agent is running, enhanced graphs will be available in the control panel.
View the Enhanced Graphs
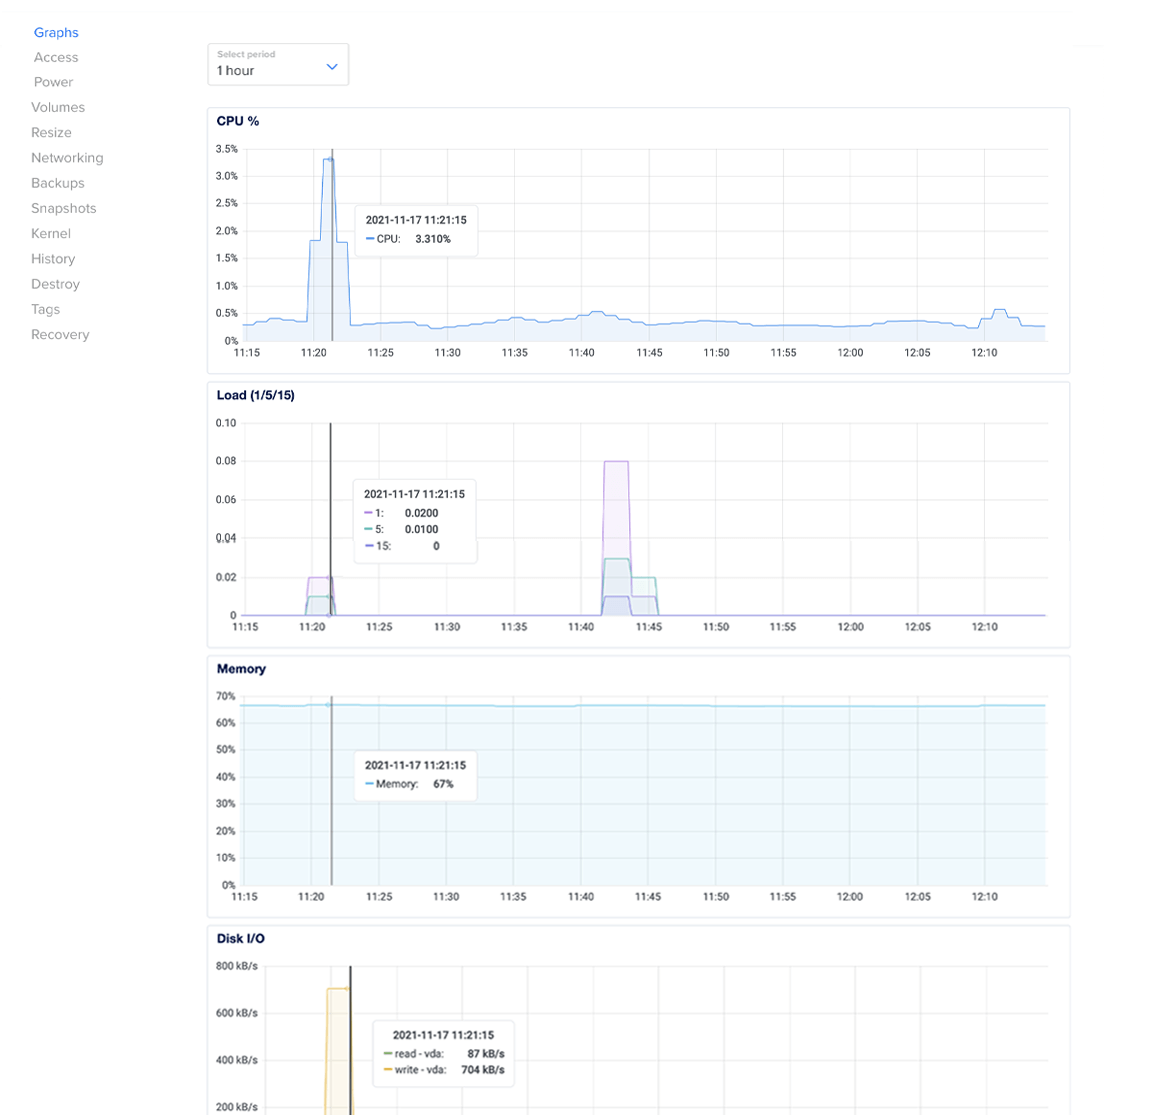
Once the metrics agent is enabled, click the Droplet’s name, which takes you to the Graphs section of your Droplet’s detail page. The extended metrics will be available once the metrics agent checks in and the initial data points are processed, which may take a few minutes.
The times displayed in the graphs are in your local time zone, determined by your browser. Use the drop-down menu to adjust the time window displayed and mouse over the graphs to view detailed information.
